Let's get you two acquainted. Look around, we really think you'll like what you see.
Feature Tour»Learn the interface and get an overview of your game via the dashboard
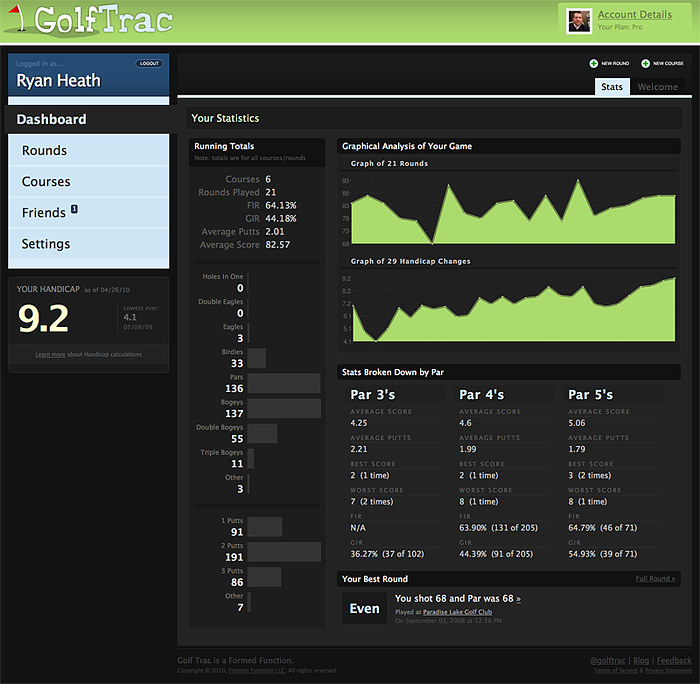
The dashboard
-
This column shows your running totals for all rounds on all courses. It's very easy
to see your average putts, FIR/GIR, how your pars compare to your bogeys, and so on.
-
Your current handicap is always shown at all times. It tells you when it was last computed, and also
shows your all-time best handicap index.

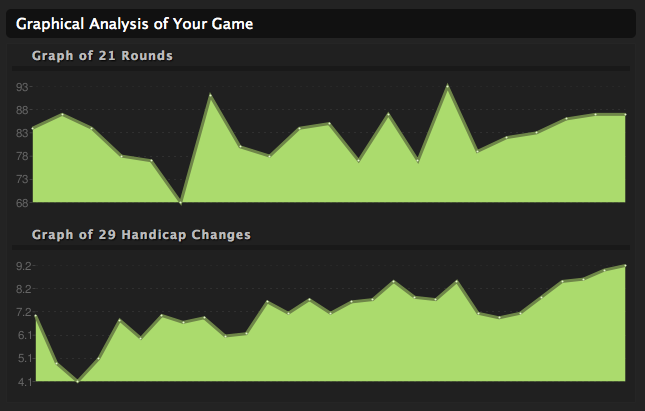
Graphical analysis
-
This is a plot of all recorded rounds. The lowest point is your best score and the highest point is your
worst score. This gives you a visual feel for your average round.
-
Since Golf Stat records every handicap change (rather than updating it) you are able to see
how your handicap has changed over time.

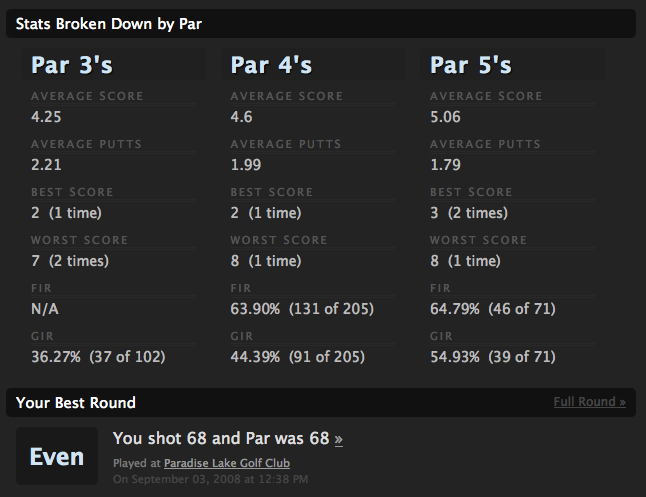
Statistical breakdowns
-
A major piece to improving is realizing your trouble areas. With this breakdown, you can easily see how well you
typically play the par 3's, 4's, and 5's for all of your recorded rounds.
-
A quick reference and link to your best recorded round.

Golf Stat is best used in a modern browser, such as
Firefox,
Safari,
Chrome,
Flock, and
IE7 or higher.
IE6 will not be supported.

 Thinking...